
Quick Summary
| Key Insight | What You Need to Know |
|---|---|
| What Is a Moderating | What Is a Moderating Variable? |
| Moderator vs. Mediator Variables | Key Differences |
| Real-World Examples of Moderation Marketing | Real-World Examples of Moderation Marketing and Customer Engagement Psychology and Behavioral Research Business Performance and Strategy |
| Marketing and Customer Engagement | Marketing and Customer Engagement |
| Psychology and Behavioral Research | Psychology and Behavioral Research |
| Business Performance and Strategy | Business Performance and Strategy |
Table of Contents
- What Is a Moderating Variable?
- Moderator vs. Mediator Variables: Key Differences
- Real-World Examples of Moderation
- Continuous vs. Categorical Moderators
- How to Write a Moderation Analysis
- Moderation Analysis Tools and Methods
- Common Pitfalls in Interpreting Moderation
- Conclusion
Last Updated: August 12, 2026
What Is a Moderating Variable?
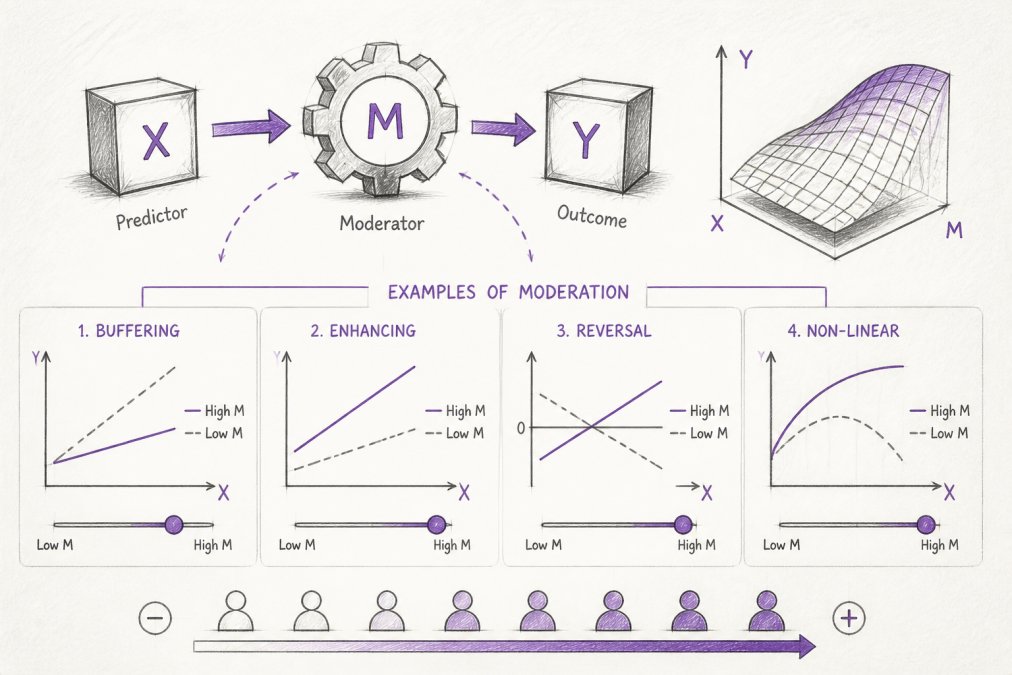
A moderating variable is a factor that changes the strength or direction of the relationship between an independent variable and a dependent variable. It explains when or under what conditions an independent variable affects a dependent variable.
Consider testing whether cold weather increases hot beverage sales. That relationship might be strong for outdoor workers but weak for office workers. Work environment is the moderating variable, it determines how much cold weather influences beverage choices.
Moderating variables help researchers move beyond simple cause-and-effect thinking to capture real-world complexity. In statistical terms, moderation is tested through interaction effects, the combined influence of two variables on an outcome. A statistically significant interaction term indicates evidence of moderation.
Moderator vs. Mediator Variables: Key Differences
The confusion between moderator vs. mediator variables is one of the most common mistakes in research design. They answer fundamentally different questions.
A mediator explains how or why an independent variable affects a dependent variable, it's the mechanism. If stress causes poor sleep, and poor sleep causes low productivity, then sleep is a mediator.
A moderator specifies when or under what conditions that relationship occurs. If stress causes poor sleep only for people with high anxiety, then anxiety is a moderator. Mediators are part of the causal chain (A → B → C), while moderators regulate the strength of that chain (A → C, but only when M is high).
In statistical analysis, mediators are tested through mediation analysis, which examines indirect effects. Moderators are tested through interaction terms in regression models, which examine how the slope changes across moderator levels.
Real-World Examples of Moderation
Marketing and Customer Engagement
Customer loyalty programs illustrate moderation clearly. The relationship between program rewards and repeat purchases is strong for budget-conscious customers but weak for high-income customers who find rewards insignificant. Income level moderates the relationship.
Email marketing frequency also shows moderation. Increased emails boost engagement on high-quality, opted-in lists but trigger unsubscribes on cold lists. List quality moderates the email frequency-engagement relationship.
Customer testimonials increase conversion rates, but the strength depends on price point. For low-cost items, testimonials have modest impact; for high-ticket purchases, they're critical decision-drivers.
Psychology and Behavioral Research
Stress and academic performance show clear moderation. Students with strong coping skills maintain performance under stress, while those without coping skills see sharp declines. Coping ability moderates the stress-performance relationship.
Motivation and task difficulty interact similarly. For easy tasks, motivation barely matters. For difficult tasks, motivation becomes critical. Task difficulty moderates the motivation-performance relationship.
Business Performance and Strategy
Market competition moderates the relationship between pricing and profitability. In highly competitive markets, higher prices don't necessarily increase profit. In less competitive markets, they do. Competitive intensity is the moderating variable.
Company size moderates the effectiveness of flat organizational structures. They work well for small teams but create chaos in large organizations.
Continuous vs. Categorical Moderators
Continuous moderators are measured on a scale with many values: age, income, temperature, engagement score. Testing a continuous moderator asks: "As the moderator increases, does the relationship strength change?"
Categorical moderators divide cases into distinct groups: gender, employment status, product category. Testing a categorical moderator asks: "Does the relationship differ across these groups?"
With continuous moderators, you report how the relationship changes per unit increase in the moderator. With categorical moderators, you compare effect magnitudes across groups. Many real-world moderators can be treated either way depending on your research question.
How to Write a Moderation Analysis
Running a moderation analysis requires clear thinking about your variables and their relationships.
Step 1: Define Your Variables Clearly
Identify your independent variable, dependent variable, and proposed moderator. Be specific about what each measures.
Step 2: Collect and Prepare Data
Gather data on all three variables. Check for missing values and outliers. Standardize or center continuous variables to improve interpretability and reduce multicollinearity.
Step 3: Run the Regression Analysis
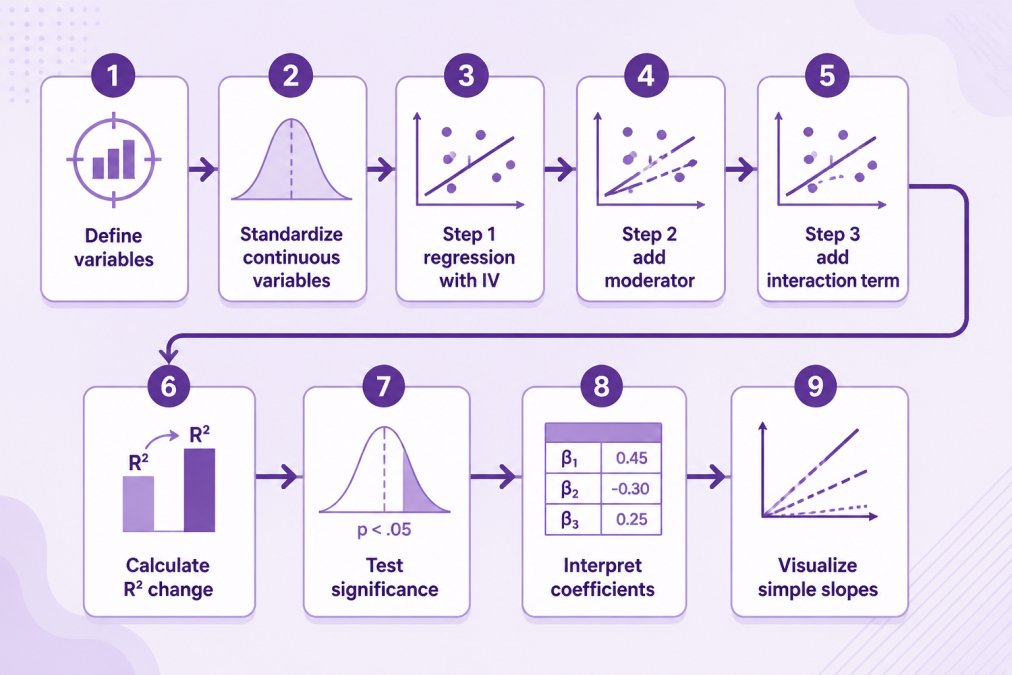
Conduct hierarchical regression with three steps:
- Step 1: Enter the independent variable alone
- Step 2: Add the moderator variable
- Step 3: Add the interaction term (independent variable × moderator)
The interaction term directly tests whether moderation exists. A statistically significant interaction indicates moderation.
Step 4: Examine the Interaction Coefficient
A significant coefficient (p < .05) indicates moderation. The sign and magnitude tell you the direction and strength.
Step 5: Calculate Simple Slopes
Simple slopes analysis breaks down the interaction into separate regression lines at different moderator values. For continuous moderators, calculate slopes at low, medium, and high values. For categorical moderators, calculate the slope for each group.
Step 6: Visualize the Interaction
Create a graph showing the interaction effect. Plot the independent variable on the x-axis, the dependent variable on the y-axis, and draw separate lines for different moderator values.
Step 7: Interpret and Report
Describe what the moderation means in practical terms. How does the relationship change? Under what conditions is it strongest or weakest?
Moderation Analysis Tools and Methods
Regression Analysis is the most common approach. Create an interaction term by multiplying the centered independent variable by the centered moderator, then include it in your regression model.
Structural Equation Modeling (SEM) works well for complex relationships involving multiple variables or latent constructs.
Multilevel Modeling is appropriate when data has nested structure, such as students within classrooms or employees within organizations.
PROCESS Macro (for SPSS and SAS) simplifies moderation analysis by automatically calculating interaction terms, simple slopes, and confidence intervals.
Python and R offer flexibility for custom analyses. Libraries like statsmodels (Python) and lm() with interaction terms (R) give full control over model specification.
For FeedGuardians users managing comment moderation across multiple platforms, understanding moderation effects explains why the same strategy doesn't work equally well everywhere. Platform type, audience demographics, and content category all moderate how moderation rules should apply.
Common Pitfalls in Interpreting Moderation
Pitfall 1: Confusing Moderation with Mediation
Moderation and mediation require different statistical tests. Always clarify whether you're testing how (mediation) or when (moderation) a relationship occurs.
Pitfall 2: Ignoring Non-Significant Interactions
A non-significant interaction term means moderation wasn't supported. Don't interpret near-significant interactions (p = .08) as evidence of moderation.
Pitfall 3: Misinterpreting Simple Slopes
All slopes are part of the moderation story. Report all of them, not just one.
Pitfall 4: Over-Interpreting Small Effects
Statistical significance doesn't equal practical significance. Always report effect sizes alongside p-values.
Pitfall 5: Testing Too Many Moderators Without Adjustment
Testing multiple potential moderators increases false positives. Use appropriate corrections like Bonferroni adjustment or pre-registration.
Pitfall 6: Assuming Moderation is Permanent
A moderation effect found in one context might not generalize. Test moderation across contexts before claiming universal patterns.
Pitfall 7: Forgetting to Center Variables
Failing to center continuous variables when calculating interaction terms creates multicollinearity and interpretation difficulties.
Conclusion
Understanding moderation transforms how you interpret relationships in data. Rather than assuming simple cause-and-effect, you recognize that most real-world relationships are conditional. This perspective applies across marketing, psychology, business strategy, and countless other fields.
When you identify moderating variables, you move from asking "Does X affect Y?" to "When does X affect Y?" That shift leads to more nuanced strategies, better predictions, and more effective interventions. FeedGuardians helps teams recognize these patterns in customer engagement data, understanding that comment moderation effectiveness depends on platform type, audience segment, and content category. By accounting for moderating variables, brands develop more sophisticated, context-aware strategies that drive better results across their entire social presence.
Frequently Asked Questions
What is a simple example of a moderating variable?
A classic example of moderation is how age moderates the relationship between exercise and health outcomes. Exercise improves health for most people, but the strength of this relationship differs by age group. For younger individuals, exercise may have a stronger effect on cardiovascular fitness, while for older adults, it may more significantly impact mobility and fall prevention. The moderating variable (age) changes how strongly exercise influences health.
How does a moderator variable differ from a mediator variable?
A moderator changes the strength or direction of a relationship between two variables but is not part of the causal pathway. A mediator, by contrast, explains how or why a relationship exists by sitting in the causal chain. For example, if advertising spend influences sales, budget size could be a moderator (changing the strength of the relationship), while customer awareness would be a mediator (explaining the mechanism of how advertising leads to sales). Understanding this distinction is critical for proper research design and statistical modeling.
Why is moderation analysis important in statistical analysis?
Moderation analysis reveals when and for whom an effect occurs, providing nuance that simple correlation or regression analysis misses. In business, this means identifying which customer segments respond most strongly to a marketing campaign, or which conditions maximize product effectiveness. Rather than assuming a relationship works the same way for everyone, moderation analysis uncovers conditional effects, enabling targeted strategies and more accurate predictions of real-world outcomes.
What is the difference between moderation and interaction?
Moderation and interaction are closely related but describe the same statistical phenomenon from different angles. Interaction refers to the statistical term in a regression model (the product of two variables), while moderation refers to the conceptual relationship where one variable changes how another affects an outcome. When you test for moderation, you are examining an interaction effect in the data. Both terms describe the same analysis, just with different emphasis, moderation focuses on the conditional nature of effects, while interaction emphasizes the statistical term.
This article was written using GrandRanker
Tired of manually moderating comments?
FeedGuardians automates spam filtering, responds to customers, and protects your brand — setup in 3 minutes.
Frequently Asked Questions
What is a simple example of a moderating variable?
A classic example of moderation is how age moderates the relationship between exercise and health outcomes. Exercise improves health for most people, but the strength of this relationship differs by age group. For younger individuals, exercise may have a stronger effect on cardiovascular fitness, while for older adults, it may more significantly impact mobility and fall prevention. The moderating variable (age) changes how strongly exercise influences health.
How does a moderator variable differ from a mediator variable?
A moderator changes the strength or direction of a relationship between two variables but is not part of the causal pathway. A mediator, by contrast, explains how or why a relationship exists by sitting in the causal chain. For example, if advertising spend influences sales, budget size could be a moderator (changing the strength of the relationship), while customer awareness would be a mediator (explaining the mechanism of how advertising leads to sales). Understanding this distinction is critical for proper research design and statistical modeling.
Why is moderation analysis important in statistical analysis?
Moderation analysis reveals when and for whom an effect occurs, providing nuance that simple correlation or regression analysis misses. In business, this means identifying which customer segments respond most strongly to a marketing campaign, or which conditions maximize product effectiveness. Rather than assuming a relationship works the same way for everyone, moderation analysis uncovers conditional effects, enabling targeted strategies and more accurate predictions of real-world outcomes.
What is the difference between moderation and interaction?
Moderation and interaction are closely related but describe the same statistical phenomenon from different angles. Interaction refers to the statistical term in a regression model (the product of two variables), while moderation refers to the conceptual relationship where one variable changes how another affects an outcome. When you test for moderation, you are examining an interaction effect in the data. Both terms describe the same analysis, just with different emphasis—moderation focuses on the conditional nature of effects, while interaction emphasizes the statistical term.