Quick Summary
| Key Insight | What You Need to Know |
|---|---|
| Conversion Rate | What percentage of people who click a link in your social post or ad actually complete a purchase? This is your most direct measure of effectiveness. |
| Average Order Value (AOV) | When someone buys from a social media link, how much do they typically spend? A higher AOV from a specific channel tells you it's attracting high-value customers. |
| Customer Acquisition Cost (CAC) | How much did it cost—in ad spend, time, and resources—to get that new customer from a social channel? You need this to know if you're actually making a profit. |
If you want to get a real handle on your social media ROI, you have to start by defining what success actually means for your business. This isn't about chasing likes or followers. It's about setting clear, revenue-focused goals and picking Key Performance Indicators (KPIs) that tie directly to your bottom line.
Defining What Social Media Success Looks Like
Before you even think about creating content or launching a campaign, you need a destination in mind. Without a clear goal, you’re essentially just throwing content at a wall and hoping something sticks—and you'll never be able to prove its value. To truly measure social media ROI, your objectives must mirror your larger e-commerce business goals.
Too many marketing teams get caught up in the vanity game, obsessing over follower counts and post likes. Sure, those numbers feel good and can hint at brand awareness, but they don't directly contribute to revenue. Real ROI measurement demands a fundamental shift: from just being seen to creating real business value.
Moving Beyond Vanity Metrics
Your job isn't just to get attention; it's to drive profitable action. This means zeroing in on KPIs that have a direct, undeniable link to sales. Think of it this way: a "like" is someone window-shopping, but a conversion is a customer walking through the door with their wallet out.
For any e-commerce brand, these are the KPIs that actually move the needle:
- Conversion Rate: What percentage of people who click a link in your social post or ad actually complete a purchase? This is your most direct measure of effectiveness.
- Average Order Value (AOV): When someone buys from a social media link, how much do they typically spend? A higher AOV from a specific channel tells you it's attracting high-value customers.
- Customer Lifetime Value (CLV): What's the total revenue you can realistically expect from a customer you brought in through social media over time? This is the holy grail for understanding long-term channel profitability.
- Customer Acquisition Cost (CAC): How much did it cost—in ad spend, time, and resources—to get that new customer from a social channel? You need this to know if you're actually making a profit.
Key Takeaway: The strongest social media strategies are built on a bedrock of revenue-driven KPIs. When you start tracking metrics like CLV and AOV, the conversation in your team meetings changes from "how many people saw our post?" to "how much revenue did that campaign bring in?"
Connecting Goals to Real-World Scenarios
Let's make this practical. Imagine you run an online apparel store and you're launching a new line of sustainable activewear. Your main business goal is to hit $50,000 in sales for this collection in the first quarter. A vague social media goal like "boost Instagram engagement" is completely useless here. It's not actionable.
Instead, a proper SMART goal would sound something like this: "Achieve $50,000 in sales from our Instagram campaign in Q1 by driving 10,000 unique visitors to the product page and hitting a 2% conversion rate."
See the difference? This approach takes a big business objective and breaks it down into specific, trackable social media targets. Now, every single post, Story, and ad has a clear purpose and can be measured against its contribution to that sales goal. This is how you turn social media from a creative guessing game into a predictable revenue driver.
When you start thinking this way, you'll understand why a recent study in an in-depth analysis of social media KPIs found that 67% of marketers now see revenue attribution as their number one measurement goal. They're all trying to connect the dots.
To set these goals well, you first need to listen to what your audience is actually talking about. Our guide on what is social listening is a great place to start. It walks you through how to tune into conversations about your brand, giving you the insights needed to create campaigns that truly connect—and convert.
To help you put this into practice, here's a simple table showing how to translate your big-picture business objectives into tangible social media metrics.
Connecting Business Goals to Social Media KPIs
| Business Objective | Primary Social Media KPI | Example Metric to Track |
|---|---|---|
| Increase overall revenue by 15% | Sales Conversion Rate | Clicks on "Shop Now" links resulting in a completed purchase |
| Boost new product line sales | Average Order Value (AOV) | Value of carts from customers clicking on new product ads |
| Improve customer retention | Customer Lifetime Value (CLV) | Repeat purchase rate from followers in your VIP Facebook Group |
| Grow market share | Website Traffic from Social | Number of unique sessions originating from social media channels |
| Reduce marketing spend | Customer Acquisition Cost (CAC) | Cost per purchase from a specific ad campaign on Pinterest |
By using a framework like this, you ensure every social media activity is purpose-driven and directly contributes to what matters most: growing your business.
Getting Your Tracking and Attribution Right
Defining your goals is a great start, but let's be honest: you can't measure ROI if your technical setup is a mess. Without a solid tracking foundation, you're just guessing where your sales are coming from. Getting your tools set up correctly is what allows you to draw a straight line from a specific social media post to a customer's wallet.
Think of it as building a digital breadcrumb trail. You want to see the exact path a customer took from scrolling their feed to clicking "buy now" on your site. When you can do that, you have the clean data you need to prove your return on investment.
This simple process shows the core idea: start with your goals, pick KPIs to match, and then measure everything.
It always comes back to this: define your business goals first, then select KPIs that reflect those goals, and finally, put the right tools in place to measure your progress.
Using UTMs to See Exactly Where Traffic Comes From
The first tool you absolutely need to master is the Urchin Tracking Module (UTM). They're just small snippets of text you add to the end of a URL, but they tell your analytics platform (like Google Analytics) precisely where a visitor came from. Consistent UTM usage is non-negotiable if you're serious about this.
A URL with UTMs attached can tell you that a sale came from your "spring-sale" campaign on Instagram, specifically from the link in your Stories. Without them, your analytics just show a vague "social media" referral, which is pretty useless.
Here’s a breakdown of the five standard parameters:
- utm_source: This identifies the platform, like
facebook,instagram, ortiktok. - utm_medium: This is the marketing channel, usually
social,cpc, oremail. - utm_campaign: Use this to name your specific campaign, like
spring_promo_2024. - utm_term: Originally for paid search keywords, but you can adapt it for ad set names.
- utm_content: This helps you tell apart links that point to the same URL. Think
video_advs.carousel_ad.
For more on this, we've put together a guide on the best tools for social media analytics that covers platforms to help manage and make sense of this data.
Installing Pixels to Track On-Site Actions
UTMs show you where people come from, but tracking pixels show you what they do once they're on your website. For any e-commerce brand, the Meta Pixel (for Facebook and Instagram) is a must-have. It’s a bit of code you place on your site that connects on-site activity back to your social media ads.
Once it's installed, the pixel tracks specific conversion events. These aren't just page views; they're the valuable interactions that lead to a sale.
Pro Tip: Don't just track the final 'Purchase' event. You should set up events for the whole customer journey—
ViewContent,AddToCart,InitiateCheckout. This gives you a full picture and shows you exactly where people are dropping off in your funnel.
Imagine someone clicks your Instagram ad, adds a product to their cart, but gets distracted and leaves. Without the AddToCart event, that lead is gone. With it, you can build a retargeting audience of cart abandoners and bring them back—a group that converts incredibly well.
Why You Need to Look Beyond Last-Click Attribution
Out of the box, most analytics platforms use a last-click attribution model. This means they give 100% of the credit for a sale to the very last thing a customer clicked before buying. So, if a customer saw your ad on Facebook, then clicked a Google search ad a week later to make the purchase, Google Ads gets all the glory.
We all know that's not the full story. Social media is huge for building awareness and helping people decide, but last-click models completely ignore that early influence.
To get a true sense of your social media ROI, you need to look at different models:
| Attribution Model | How It Works | Best For |
|---|---|---|
| Last-Click | Gives all credit to the final touchpoint before conversion. | Quick, simple analysis, but often misleading. |
| First-Click | Gives all credit to the first touchpoint in the customer journey. | Seeing which channels kickstart the customer journey. |
| Linear | Spreads credit evenly across all touchpoints. | Getting a balanced view when you have a longer sales cycle. |
| Time-Decay | Gives more credit to touchpoints closer to the sale. | Brands with short sales cycles where recent touchpoints matter most. |
Picking the right attribution model helps you see the real impact of your social media, not just the final click. It gives you the evidence you need to justify your budget and make smarter decisions about where to invest your time and money.
Putting a Dollar Value on Social Media Actions
So, you’re tracking conversions. That’s a massive win. But to really get a handle on social media ROI, you need to connect every meaningful action back to a real dollar amount. Things like reach and engagement are useful indicators, but they don't pay the bills. Profit does. This is where we stop looking at social data in a vacuum and start linking it directly to your bottom line.
It’s all about changing the conversation from, "This post got 500 clicks," to "This post drove an estimated $1,250 in potential value." That simple shift is what allows you to make smarter budget decisions and finally prove the financial muscle of your social media strategy.
From First Purchase to Lifetime Loyalty
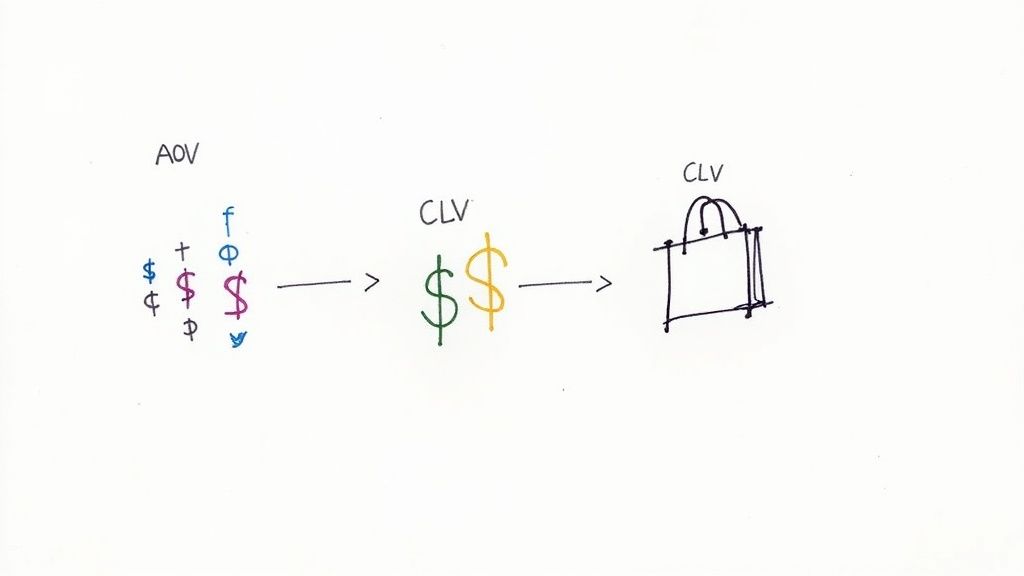
The easiest place to start is with your Average Order Value (AOV) from social media. It’s a clean, simple metric that tells you exactly how much a customer typically spends in a single purchase when they come from one of your social channels.
The formula is straightforward: Total Revenue from Social Media / Number of Orders from Social Media = AOV
But a single transaction is just the first chapter. The real story is told through Customer Lifetime Value (CLV), which estimates the total amount of money a customer will spend with you over their entire relationship with your brand. Think about it: a customer who makes one $50 purchase is great. But a customer who spends $50 every few months for the next two years? That's a game-changer.
Calculating a precise CLV can get pretty involved, but here’s a basic way to look at it:
- (Average Annual Customer Profit) x (Average Customer Lifespan in Years) – Customer Acquisition Cost (CAC) = CLV
Knowing your CLV helps you see which platforms are delivering truly valuable, long-term customers, not just one-hit wonders.
How to Value Actions That Aren't Sales
Not every click leads directly to a checkout. What about the leads, the email signups, and the free trial downloads? These actions have real monetary value because they represent future revenue. Your job is to figure out just how much that potential is worth.
Let's work through an example: assigning a value to an email signup from an Instagram lead ad.
- Find your Lead-to-Customer Conversion Rate: Dig into your historical data. Let's say you know that, on average, 10% of your email subscribers eventually make a purchase.
- Know your Customer Lifetime Value (CLV): From the previous step, let's assume your average CLV is $300.
- Calculate the Value of a Single Lead: Now, you can put a price tag on every new email address you collect.
Here’s the math: CLV x (Lead-to-Customer Conversion Rate) = Value per Lead
In our example: $300 (CLV) x 0.10 (10% conversion rate) = $30
All of a sudden, that Instagram campaign that brought in 100 new email subscribers didn't just grow your list—it generated $3,000 in potential future revenue.
This approach completely changes how you view top-of-funnel marketing. You’re not just collecting emails anymore; you’re acquiring assets with a predictable future value. It makes it so much easier to justify spending on campaigns that build your audience, even if they don't drive sales today.
This process also shows why it's so important to understand how your audience feels. To get a better read on this, you can explore social media sentiment analysis tools to see if the engagement you're getting is positive and from genuinely interested people. By tying every action back to a dollar value, you get a much clearer, more powerful picture of what your social media is truly worth.
Calculating Your Social Media ROI The Simple Way
Alright, you've done the heavy lifting: you’ve set your goals, your tracking is in place, and you've put a dollar value on what your social media actions are worth. Now for the fun part—let's see what it all adds up to. This is where we stop guessing and start calculating the real return your social media is bringing to your brand.
The formula for social media ROI is actually pretty straightforward. It’s designed to give you a clean, simple percentage that tells you exactly how much profit you've made for every single dollar you put in.
At its core, the math looks like this:
[(Profit – Investment) / Investment] x 100 = Social Media ROI %
This little equation is your best friend for cutting through the vanity metrics. It delivers a powerful, bottom-line number. If it’s positive, you’re making money. If it’s negative, you know something needs to change.
Putting the Formula into Action
Let’s run through a real-world scenario. Imagine your e-commerce store sells artisanal coffee beans. You decide to launch a Facebook ad campaign for your new "Morning Brew Starter Kit," which you sell for $60. The campaign is set to run for one month.
First things first, we need to add up every single cost. And I mean everything—not just the ad spend.
- Ad Spend: You put $2,000 directly into Facebook ads.
- Content Creation: You hired a freelance videographer for $500 to make the ad look amazing.
- Team Time: Your social media manager spent about 10 hours managing this campaign. At an internal rate of $50/hour, that's another $500.
- Software: Your social media management tool is $100 a month. You can fairly attribute $25 of that cost to this specific campaign.
So, your total investment comes to $3,025.
Now for the return. Because you set up your UTMs and Meta Pixel properly, you can see exactly how many sales came from this campaign. Over the month, you sold 100 starter kits.
100 kits x $60/kit = $6,000 in Revenue
Time to plug it all into our formula:
[($6,000 – $3,025) / $3,025] x 100 = 98.3% ROI
What does this tell you? For every dollar you invested, you made that dollar back plus another 98.3 cents in pure profit. Now that is the kind of hard data that proves your work is paying off. Getting this calculation right is non-negotiable, especially when you consider that global social media ad spend is expected to reach $276.7 billion by 2025. With that much at stake, there's no room for guesswork. You can explore more social media ROI insights on vistasocial.com to see why this matters so much.
Knowing the Difference Between ROI and ROAS
I see this all the time: marketers use ROI and Return on Ad Spend (ROAS) interchangeably. They are not the same thing, and knowing the difference is crucial for seeing the full picture.
Key Difference: ROAS measures gross revenue from your ad spend alone. ROI measures your actual profit after all associated costs are factored in.
Think of it like this: ROAS tells you if your ads are working, while ROI tells you if your entire strategy is profitable.
- ROAS Formula: (Revenue from Ads / Ad Spend) x 100
- ROI Formula: [(Revenue - Total Investment) / Total Investment] x 100
Let's look at our coffee brand example again to see how different the numbers can be:
| Metric | Calculation | Result | What It Tells You |
|---|---|---|---|
| ROAS | ($6,000 Revenue / $2,000 Ad Spend) | 3x or 300% | For every $1 you spent on ads, you generated $3 in revenue. A great sign of ad efficiency. |
| ROI | [($6,000 - $3,025 Total Costs) / $3,025] | 98.3% | After paying for everything, the entire effort was 98.3% profitable. This is your true business impact. |
See the difference? Both metrics are incredibly useful. ROAS is fantastic for quick, in-the-moment checks on ad performance. But ROI is the ultimate truth-teller about whether your campaign was a financial success. To make truly smart decisions, you need to track both.
Using Your ROI Data to Make Smarter Decisions
So, you've crunched the numbers and calculated your social media ROI. Great. But that's not the end of the road—it's just the beginning. The real magic happens when you use that data to make better, faster decisions that actually grow your business.
Think of your ROI data not as a report card to justify your budget, but as a living feedback loop. It's the engine that powers your strategy. When you get into a rhythm of analyzing what’s working (and what’s a complete flop), you can stop throwing money at campaigns that go nowhere and double down on the channels that are making you money.
Building a Repeatable Reporting System
To make this happen, you need a system. A simple, repeatable way to see what's going on without getting lost in a sea of spreadsheets. For most teams, a monthly social media ROI dashboard is the perfect solution. It gives you—and anyone else who needs to know—a quick, clear snapshot of performance.
A good dashboard tells a story. It shouldn't just be a data dump. It needs to answer three simple questions: What happened? Why did it happen? And what are we doing next?
Here's what I recommend including in yours:
- The Big Picture: Start with the headline numbers. What was your total ROI this month? How much revenue did social bring in? What was the total cost?
- Channel Breakdown: Split your ROI by platform (Instagram, Facebook, TikTok, etc.). This is the fastest way to see where your budget is getting the most bang for its buck.
- Campaign Winners: Shine a spotlight on the specific campaigns that killed it. Call out their ROI, ROAS, conversion rate, and cost per acquisition (CPA).
- Learnings & Next Steps: This is where the real value is. What did you learn? Based on the data, what are you going to change next month?
Pro Tip: Don't just use tables. People digest visuals much faster. A simple line chart showing month-over-month ROI tells a much more powerful story than a column of numbers ever will.
Below is an example of what a simple, effective dashboard might look like. It's clean, easy to scan, and focuses on the metrics that actually matter for making decisions.
Example Monthly Social Media ROI Dashboard
| Metric | This Month | Previous Month | Change (%) | Notes/Insights |
|---|---|---|---|---|
| Total Social Media ROI | 250% | 220% | +13.6% | Overall growth driven by strong performance on Instagram. |
| Total Revenue | $15,000 | $12,500 | +20% | New UGC campaign launched mid-month was a major contributor. |
| Total Investment | $4,285 | $3,906 | +9.7% | Increased ad spend slightly on Facebook to test new creative. |
| ROI by Channel (Insta) | 350% | 310% | +12.9% | Reels continue to outperform all other formats. |
| ROI by Channel (FB) | 180% | 190% | -5.3% | New ad creative underperformed. Pausing and re-evaluating. |
| Top Campaign (UGC) | 410% ROAS | N/A | N/A | User-generated content is clearly resonating. Plan to source more. |
This kind of reporting turns a pile of data into a clear action plan, which is exactly what you want.
Turning Insights into Actionable Optimizations
With a clear dashboard in hand, you can start connecting the dots and making smart tweaks to your strategy.
Let’s say your report shows an Instagram Reels campaign brought in a 150% ROI, but your TikTok video ads barely broke even at 5% ROI. The next move is obvious: pull some of that TikTok budget and push it into what's already working on Instagram.
Or maybe you notice an ad featuring user-generated content got a 50% higher click-through rate than your slick, professional studio shots. That's a huge insight. It tells you to lean into more authentic, customer-driven creative for your next campaign. This is where learning how to improve social media engagement really pays off, because engaged users are far more likely to convert.
It also helps to know where you stand in the broader market. Recent global surveys from late 2024 showed that 28% of marketers see Facebook as their highest-ROI channel, with Instagram right behind at 22%. For many e-commerce brands, it’s not uncommon to see returns of 4x to 5x on their Facebook ad spend. Use these numbers as a benchmark. If you're lagging, it might be time to dig in and see where you can optimize. If you want to go deeper on this, you can discover more social media marketing insights on sproutsocial.com.
By creating this cycle of measuring, learning, and optimizing, your ROI data becomes your roadmap. It guides you toward smarter spending, better content, and ultimately, more profitable growth for your brand.
Quick Answers to Tough Social Media ROI Questions
Even with the best playbook, you're going to hit some tricky spots. Measuring the return on your social media spend isn't always straightforward, and what works for a fashion brand might be totally wrong for a SaaS company. Let's tackle some of the most common questions that pop up.
Think of this as your go-to guide for when the data gets a little fuzzy and you need a clear, practical answer to get back on track.
How Often Should I Actually Calculate My ROI?
There's no magic number here. The right cadence really depends on what you're trying to figure out. You wouldn't check your yearly stock performance every day, right? Same principle applies.
- For active paid campaigns: You need to be looking at this weekly. This is all about agility. A weekly check-in lets you spot a losing ad, double down on a winner, and shift your budget before you burn through too much cash.
- For your overall strategy: A monthly report is the sweet spot. It smooths out the daily noise and gives you enough data to see real trends. This is perfect for those high-level dashboards you share with your boss or leadership team.
- For big-picture planning: Look at your ROI quarterly. This is when you make the big moves. A quarterly review helps you decide if it's time to invest more heavily in TikTok or maybe pull back from a platform that's just not performing.
So, What Is a "Good" Social Media ROI?
Everyone wants a single number, but the honest-to-goodness answer is: it depends entirely on your business. You’ll often hear a 5:1 ratio (that's a 400% ROI) tossed around as a great benchmark, but chasing an industry average can send you down a rabbit hole.
Think about it. Your profit margins, your industry, and your average order value (AOV) are huge factors. A company dropshipping low-margin gadgets might need a 10:1 return just to stay afloat. On the other hand, a brand selling high-margin digital products could be thrilled with a 3:1 return.
The only benchmark that truly matters is your own. The goal is steady, consistent improvement. If you hit a 250% ROI last quarter and you're at 300% this quarter, that's a win. Period. Don't worry about what everyone else is doing.
How Can I Measure ROI for a Brand Awareness Campaign?
This one's tough because not every campaign is about driving immediate sales. Sometimes, you just need to get your name out there. Measuring the ROI on these top-of-funnel campaigns means you have to get a little creative and look at metrics that signal future value.
Instead of tracking direct sales, focus on these KPIs:
- Growth in branded search: Are more people Googling your brand by name after seeing your ads? That's a fantastic indicator.
- Audience growth rate: How fast are you adding new, relevant followers to your community?
- Share of Voice: How does your brand's conversation volume stack up against your key competitors?
If you need a more direct link to financial value, you can run brand lift studies. Platforms like Facebook and YouTube offer these tools, which use surveys to measure how your ads impacted things like brand recall and purchase intent. It’s a great way to put a harder number on your awareness efforts.
Which Social Media Platform Has The Best ROI?
The best platform is simply wherever your ideal customers hang out and are most open to buying what you sell. If you're a home decor brand, your goldmine is probably Pinterest or Instagram. If you're a B2B software company, LinkedIn is almost certainly your best bet.
There’s no shortcut here—you have to test and measure. Run small, controlled campaigns across a few different platforms. Track everything with clean UTMs. The data will quickly tell you where your money is best spent. Your own ROI calculations are the only guide you need to find the most profitable channels for your brand.
Keeping your social media profitable means making sure every interaction counts. With FeedGuardians, you can automatically hide spam, reply to customer questions instantly with AI, and detect comments that show purchase intent. This turns your comment section from a chore into a conversion engine. Learn how to protect your brand and boost your ROI with FeedGuardians.
Tired of manually moderating comments?
FeedGuardians automates spam filtering, responds to customers, and protects your brand — setup in 3 minutes.